
ConnectServices
The operationnal WebSIG for managing and monitoring your networks and infrastructure
Map and schematic visualization, editing tools, operational dashboards, and an integrated AI assistant to unlock the full potential of your data.

ConnectServices enables you to edit, centralize, visualize, analyze, and share your network data within an ergonomic operational WebGIS designed for real-world use. Provide broad access to your data, monitor field activities, and turn your data into decisions with advanced views, statistical indicators, and an integrated AI assistant.
NEW !
Edit, create, and update your geospatial data repositories

With its new editing mode, ConnectServices expands its capabilities, enabling not only the visualization, management, and sharing of geospatial data, but also its creation, updating, and modification directly within the platform.
This evolution marks a significant milestone: it completes the platform’s functional building blocks to deliver a more comprehensive, seamless, and collaborative experience, closely aligned with operational needs.
With this new capability, ConnectServices reaches an important functional milestone.
The editing mode is not a standalone feature; it is fully integrated into the platform, reinforcing its overall consistency. Once data is created or updated, it can be immediately visualized, shared, leveraged, and managed within the same environment.
This is a strong differentiator: it remains very rare for a WebGIS to offer true editing capabilities, which are typically reserved for desktop GIS solutions.
Why ConnectServices is the essential GIS tool for managing your networks ?
The management of networks and infrastructure involves a wide range of stakeholders: operators, engineering firms, local authorities, service providers, subcontractors, project managers, and more. A recurring challenge remains: accessing the right information, at the right time, in the right version—and above all, reliable data.
ConnectServices addresses this need for data sharing between stakeholders by offering an online mapping tool enriched with usage-oriented features, enabling all users—even those without GIS expertise—to easily access and understand the data.
With ConnectServices, you benefit on three key levels:
- Accessibility: geospatial data managed by operational experts, accessible and usable by a wide audience—without the need for multiple exports
- Management: move from raw data to operational control (progress tracking, priorities, risks, maintenance)
- Collaboration:all stakeholders work from a shared data repository, with a unified view of the network
ConnectServices adapts to all types of infrastructure but is particularly designed to meet operational needs in the following sectors:
- Water (drinking water, wastewater, stormwater)
- Energy (gas, electricity, renewable energy, etc.)
- Public lighting
- Telecommunications & fiber optics
- Electric vehicle charging infrastructure (EV charging stations)
- Public works
An operational WebGIS designed around your needs and budget constraints
ConnectServices is an operational WebGIS designed for organizations that need to manage networks and infrastructure: easy access, operational insights, broad data sharing, activity tracking, and performance indicators. ConnectServices is not a general-purpose GIS intended to cover all advanced GIS use cases.
This operational approach delivers a very concrete advantage: a clear functional scope aligned with real-world field and management use cases. As a result, you avoid unnecessary complexity and features you don’t need on a daily basis, while making adoption easier for a wide range of users (operations teams, field staff, partners, decision-makers).
Less complexity, more usability, and better cost control.
By focusing on operational needs, ConnectServices helps you better define and manage costs: a clearer deployment scope, more predictable scalability, and reduced reliance on heavy configurations or expert profiles for everyday use.
What you can manage and monitor with ConnectServices
Integrate and cross-reference data from multiple sources
Plan and monitor field activities (interventions, inspections, operations)
Manage your assets and maintain a reliable network view
With ConnectServices, you structure your infrastructure knowledge: assets, network segments, sites, operational attributes, condition, and history. The goal: a clear asset view, usable by both operational teams and decision-makers.
Share data access with a wide range of users
ConnectServices democratizes access to geospatial data: store and track history, browse, filter, and understand assets—without relying on expert tools or constantly depending on GIS specialists.
Monitor, prioritize, maintain
ConnectServices makes supervision and prioritization easier: identify areas to address, track progress, and share a common view of actions (maintenance, inspections, targeted campaigns, resilience, etc.).
Advanced features of ConnectServices: go beyond mapping
In ConnectServices, certain features transform the WebGIS into a true management tool: field data qualification, impact analysis, activity tracking, and faster insights powered by AI.
Built-in AI assistant: make insights accessible to all

In ConnectServices, the AI assistant helps simplify analysis and make data exploration more intuitive, following a “business question → data insight” approach. Dotic places AI at the core of the GIS (with the Connie assistant), enabling users to interact with data in natural language, personalize analysis, and support decision-making.
Some use cases
- Explore a scope without prerequisites (area, network, asset types, status)
- Generate operational insights and indicators faster
- Speed up the preparation of reports and operational reviews
What it replaces
Technical queries, back-and-forth between teams, and reliance on a few expert profiles.
Result
Greater autonomy and a faster path from data to decision
Street View : visualize the field without going on-site

In ConnectServices, Street View visualization allows you to place an asset in its real-world context (facade, pole, chamber, road footprint, accessibility) to secure decision-making before dispatching a field team.
Some use cases
- Prepare an intervention (access, constraints, risks)
- Validate a report (consistency between data and field reality)
- Quickly resolve uncertainties (avoid back-and-forth)
What it replaces
Blind checks, imprecise exchanges, or exploratory site visits.
Result
Improved planning reliability and stronger coordination across stakeholders
Example: an incident is reported. In the schematic view, the user identifies the common asset explaining the impact on upstream and downstream entities, understands the network path, and determines the type of intervention required.
Schematic view: get a clear understanding of your network at a glance

The schematic view in ConnectServices provides a functional understanding of relationships between assets (connections, dependencies, sequences, statuses). It complements the map when you need to quickly understand “what depends on what.”
Some use cases
- Identify the impacts of an anomaly or incident
- Trace upstream and downstream along a chain of assets from a piece of equipment, a site, or an area
- Check the consistency of a dataset (continuity, connections, structure)
What it replaces
Time-consuming layer-by-layer analysis or external diagrams not synchronized with the data.
Result
Improved planning reliability and stronger coordination across stakeholders
Example: an incident is reported. In the schematic view, the user identifies the common asset explaining the impact and prioritizes the intervention.
Statistical indicators: move from monitoring to managing

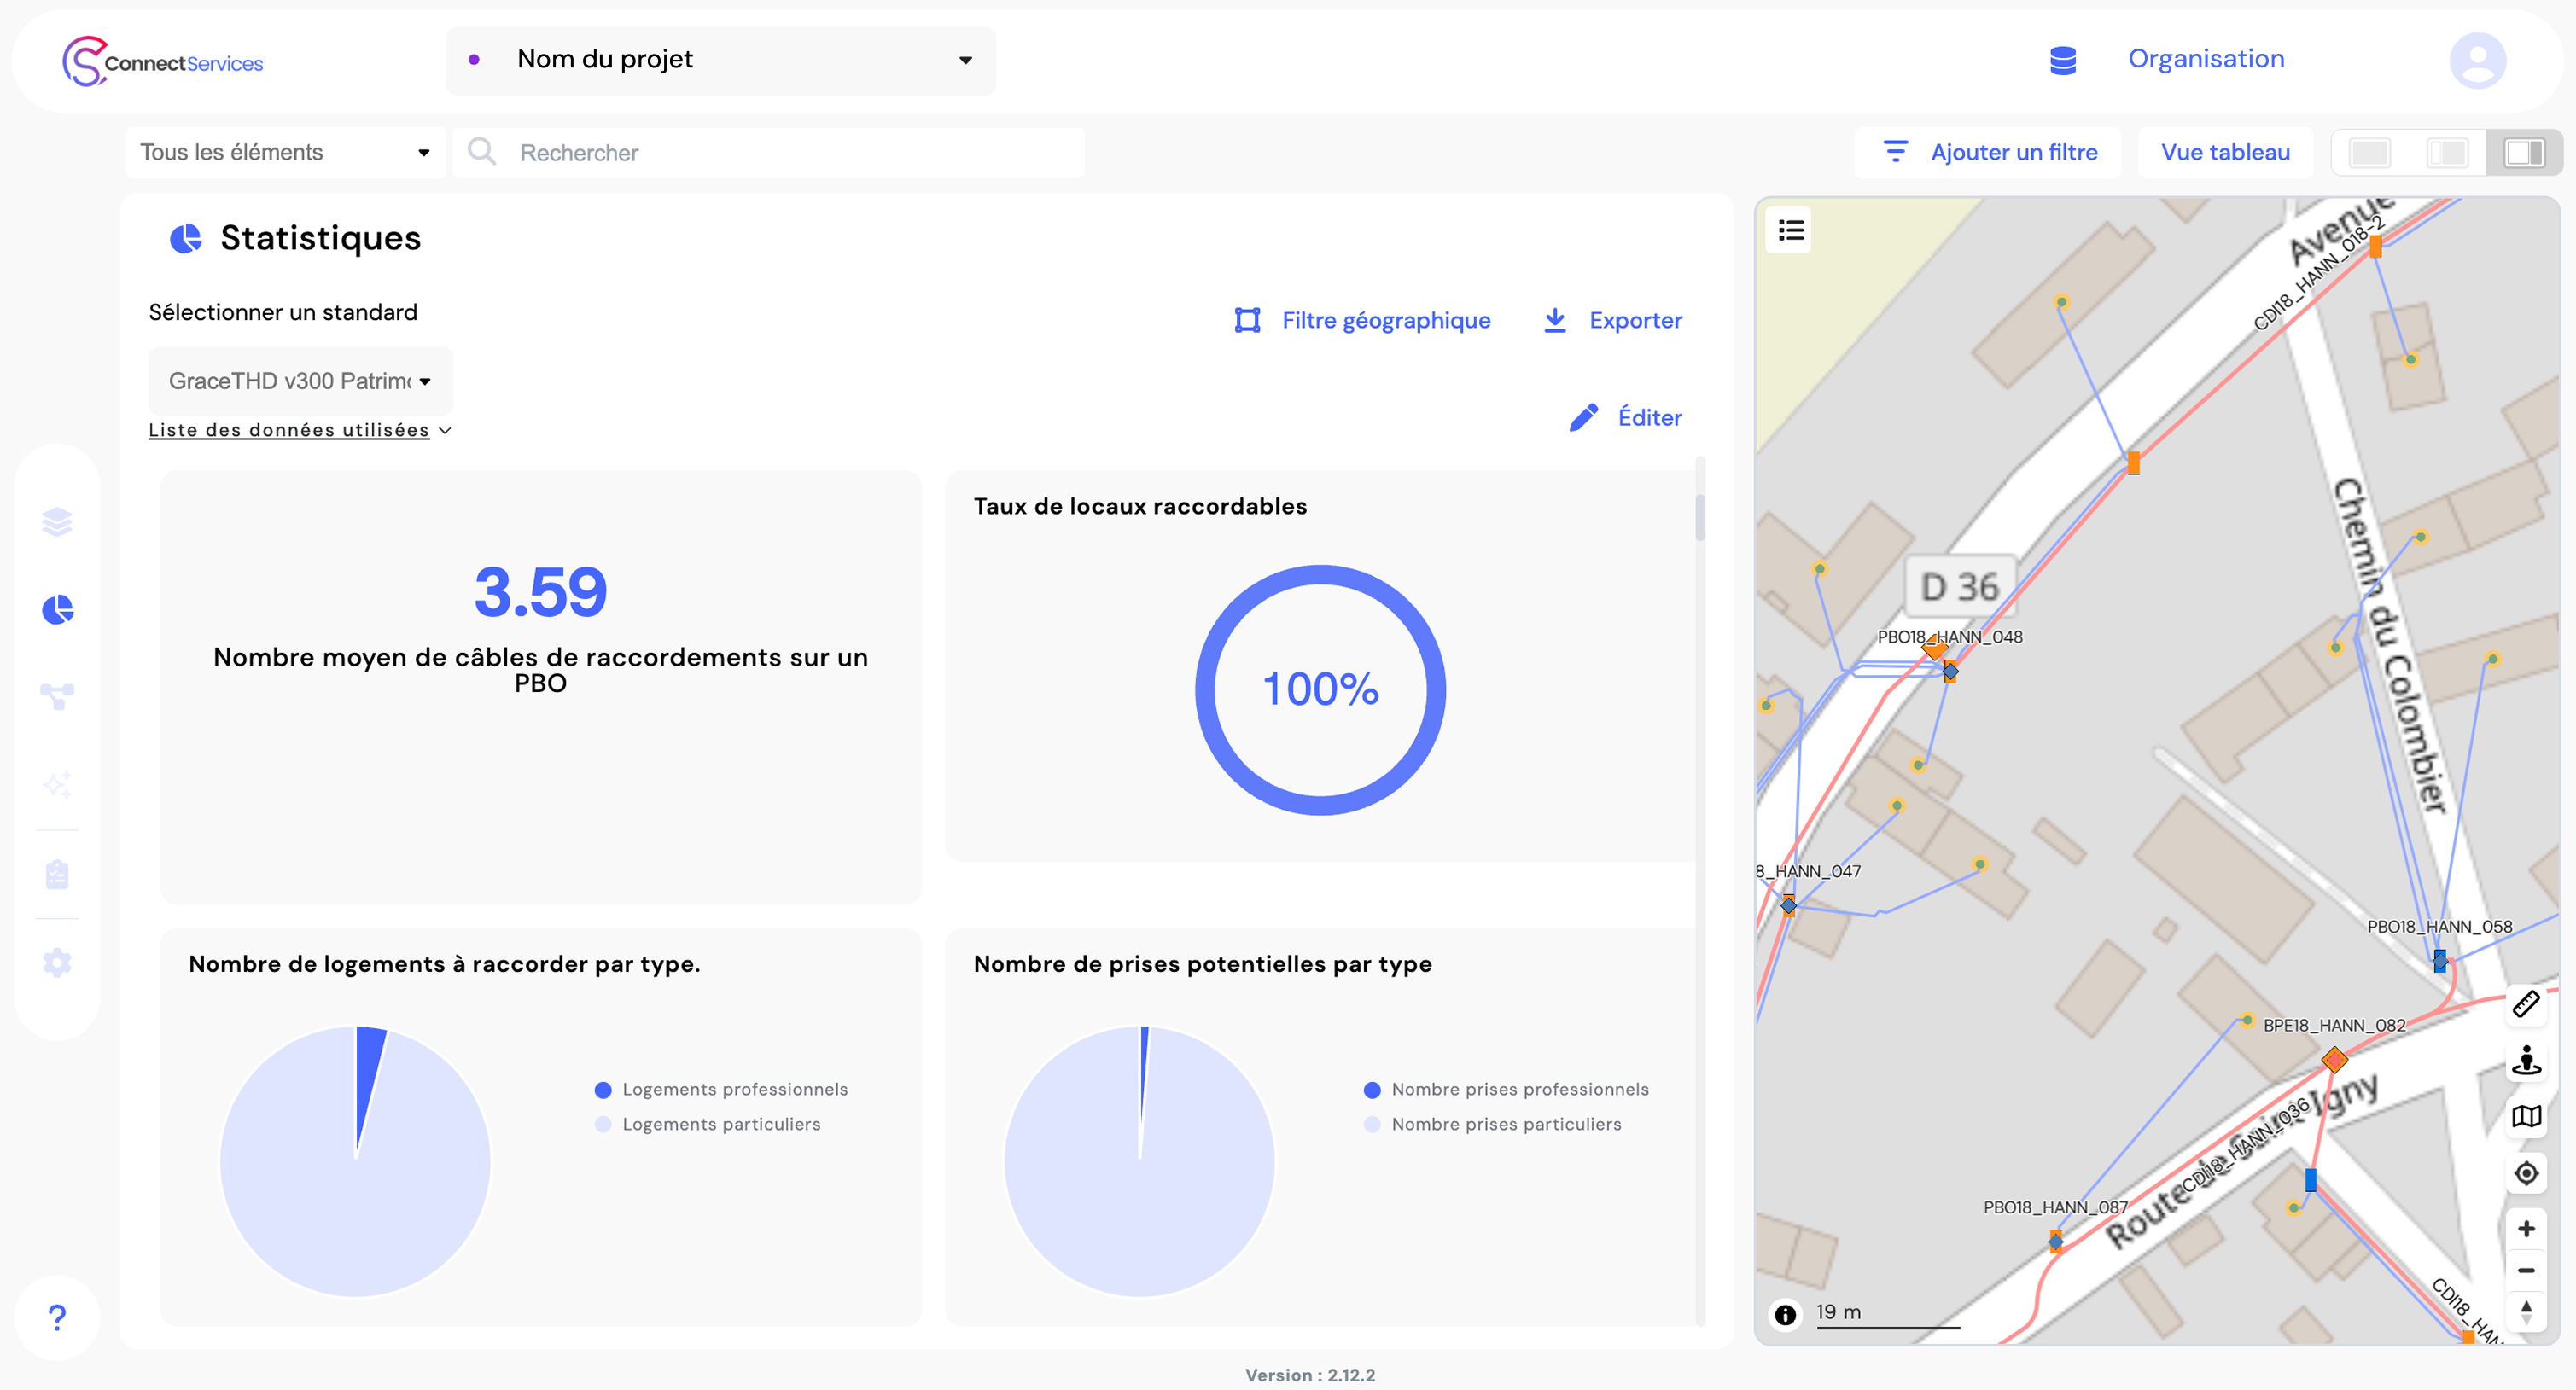
In ConnectServices, indicators turn data into actionable insights: volumes, status, completeness, distribution, trends over time, and field activity. The goal is to monitor the situation and prioritize actions.
Each authorized user can organize statistics through a dynamic dashboard tailored to their needs.
Statistics can also be calculated by territory (municipality, deployment area, etc.).
Examples of useful indicators (multi-network)
- Completion rate by area / network / asset type
- Assets to be inspected (by status, priority, anomaly)
- Volumes by type (equipment, segments, sites)
- Civil engineering network length
- Update trends (weekly/monthly)
- Interventions: completed / pending / overdue
- “Top” areas: density, incidents, anomalies, etc.
What it replaces
Recurring data exports, manual spreadsheets, or analyses limited to a few expert profiles.
Result
A shared understanding of the situation and easier decision-making (prioritization, planning, monitoring)
Example: the operations manager monitors data completeness and activity in a given area on a weekly basis. They launch a targeted inspection campaign and track improvements over time.
Data editing: build and maintain your network data models
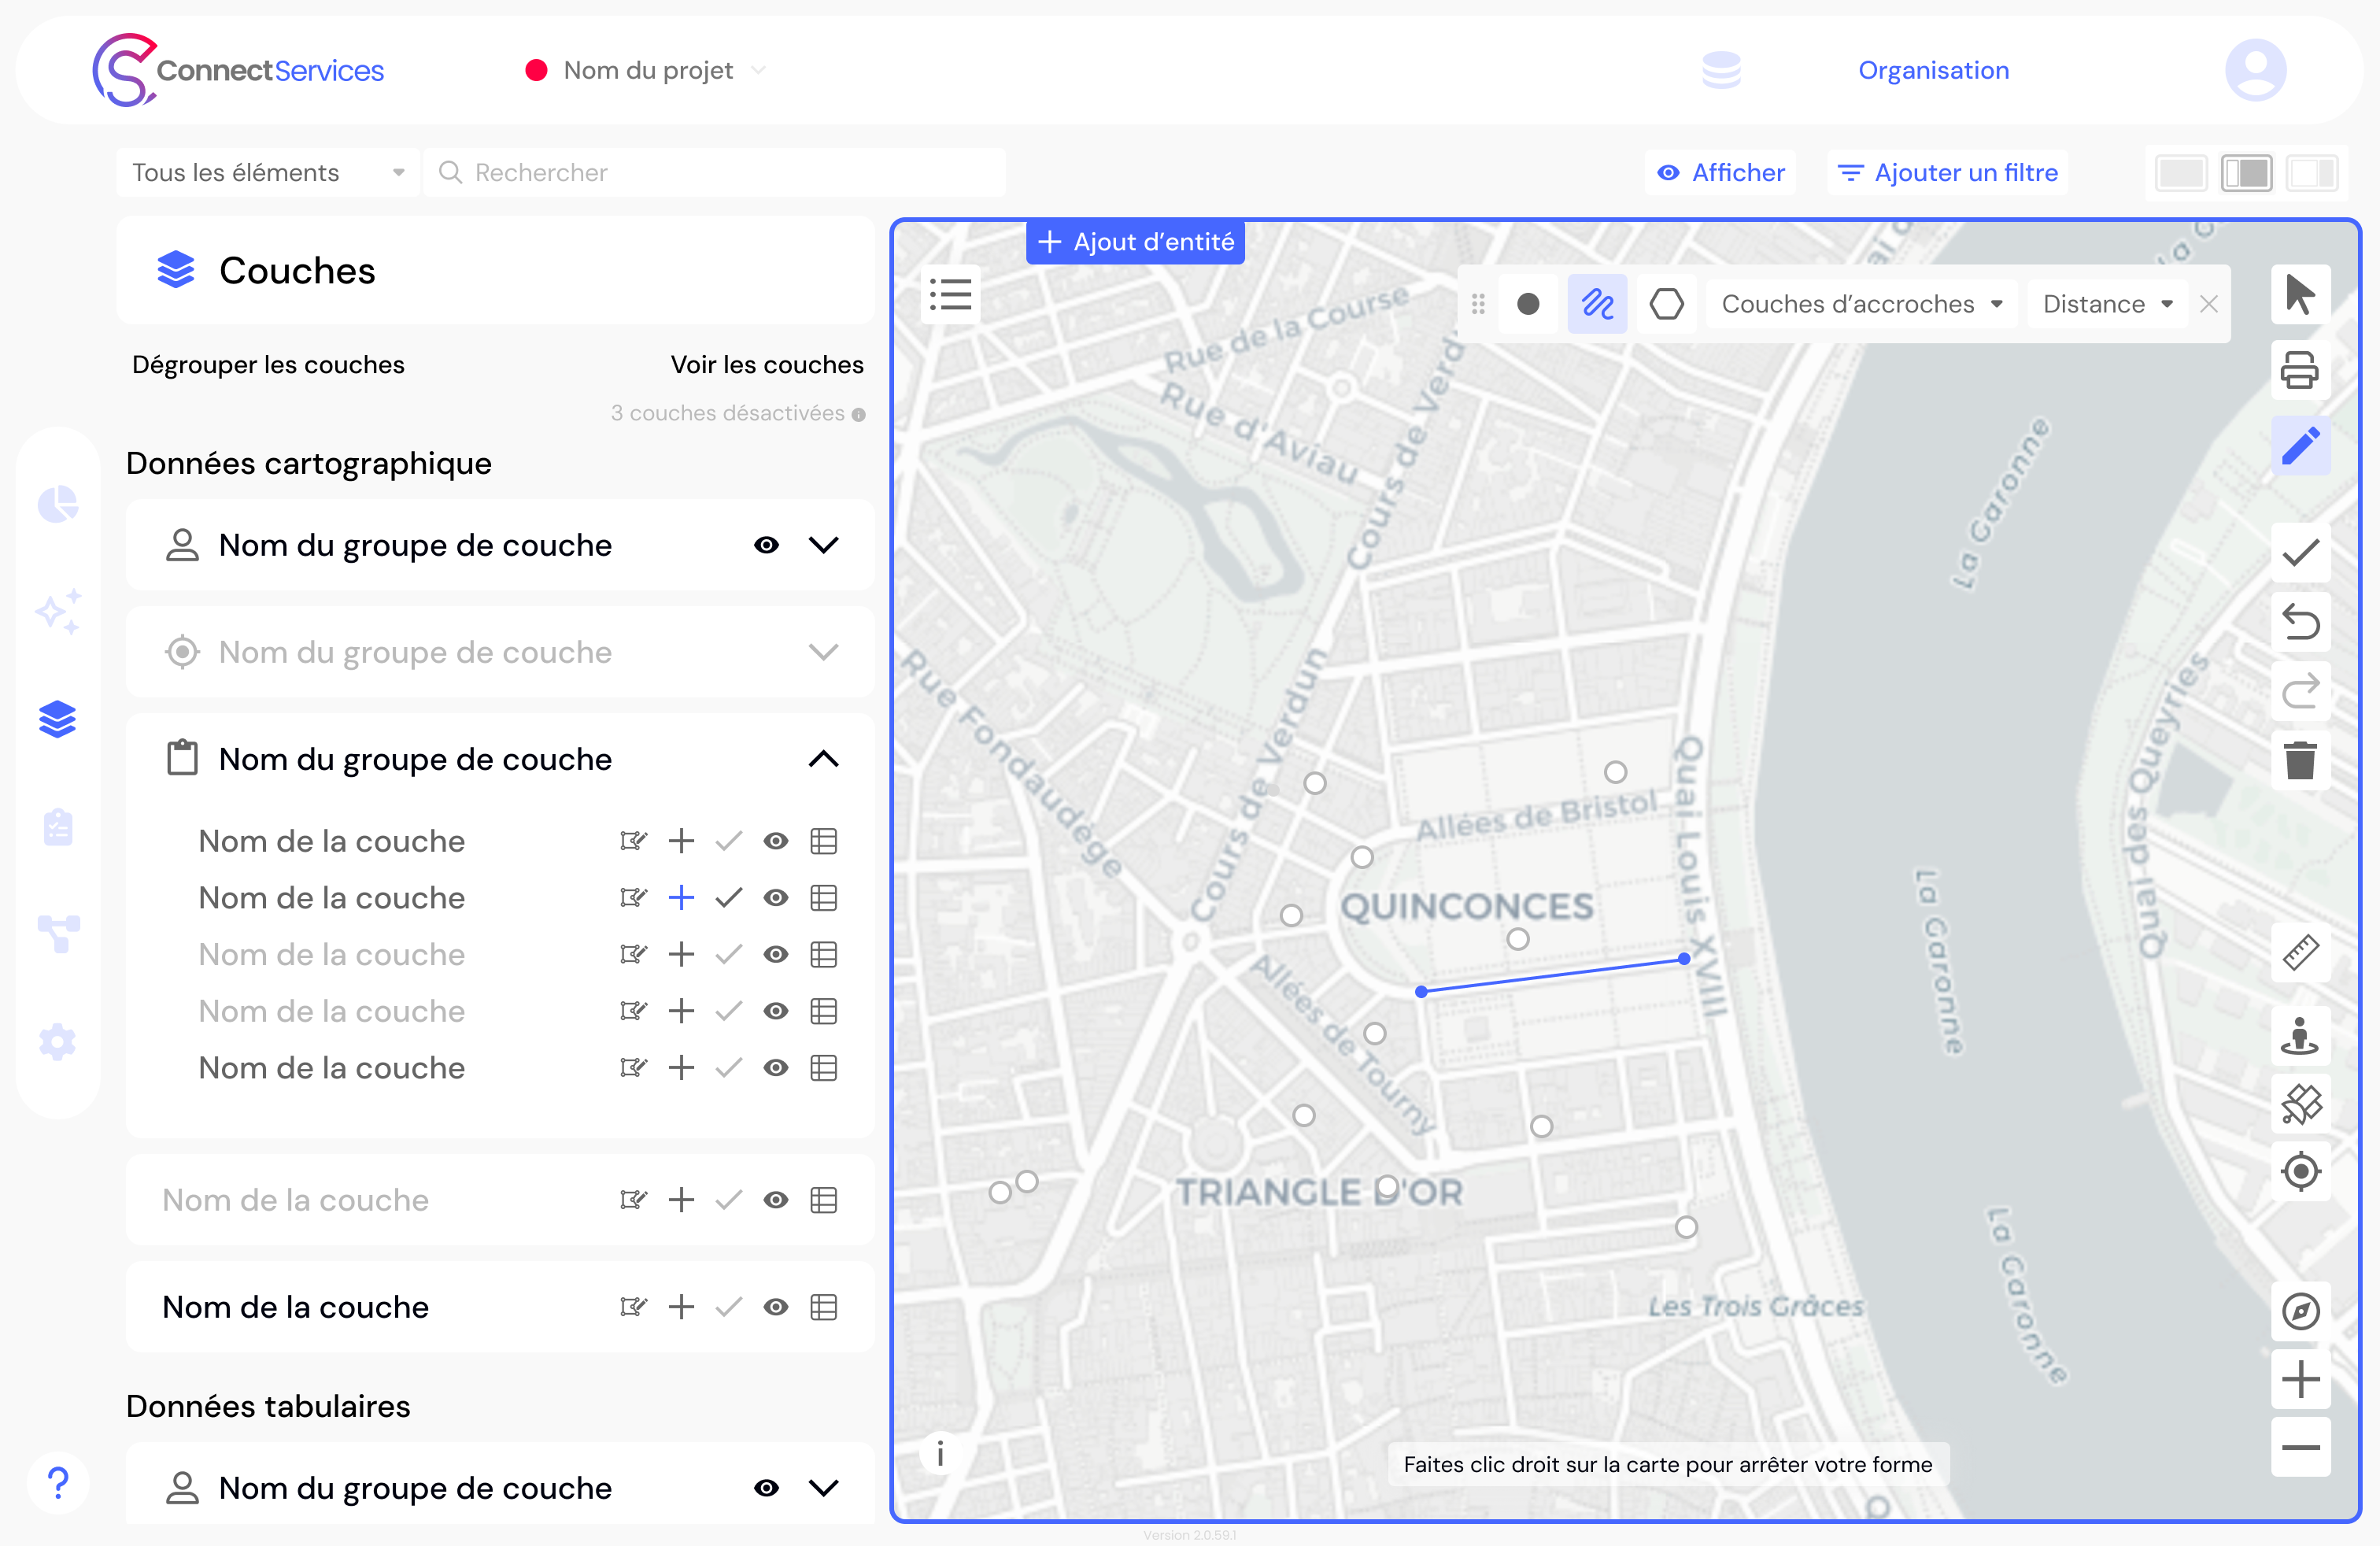
The editing mode allows you to create, update, modify, or delete geospatial features and their associated attributes directly within ConnectServices.
Some use cases
- Create a new network or extend an existing one
- Update infrastructure assets
- Modify the geometry or attributes of existing assets
- Update the status of an asset
- Manage different types of geolocated assets beyond networks, such as trees, bike stations, or other field equipment
Objective
Enable users to design, evolve, and ensure the reliability of their data directly within the GIS tool, without having to switch between different work environments.